ACC: Chemical Activity Barometer improves with US economy

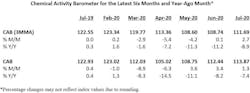
The Chemical Activity Barometer (CAB), a leading economic indicator created by the American Chemistry Council (ACC), rose 2.7% in July on a three-month moving average basis following a 0.1% gain in June.
On a year-over-year basis, the barometer fell 8.9% in July, ACC reported.
The unadjusted data show a 1.3% gain in July following a 3.4% gain in June and a 3.6% gain in May. The diffusion index rose to 41%. The diffusion index marks the number of positive contributors relative to the total number of indicators monitored. The CAB reading for June was revised upward by 1.36 points and the May reading was revised upward by 1.40 points.
“With three consecutive months of gains, the latest CAB reading is consistent with recovery in the US economy,” said Kevin Swift, chief economist at ACC.
The CAB has four main components, each consisting of a variety of indicators: Production, equity prices, product prices, and inventories and other indicators.
Production-related indicators were mixed in July. Despite improvement in new home sales, housing starts and building permits, trends in construction-related resins, pigments and related performance chemistry were soft. Reflecting a recovery in light vehicles and other industries, resins and chemistry used in durable goods were mixed. Plastic resins used in packaging and for consumer and institutional applications were mixed. Performance chemistry strengthened, while US exports were mixed. Equity prices gained, and product and input prices strengthened. Inventory and other supply chain indicators turned positive.
The CAB is a leading economic indicator derived from a composite index of chemical industry activity. Due to its early position in the supply chain, chemical industry activity has been found to consistently lead the US economy’s business cycle, and the barometer can be used to determine turning points and likely trends in the broader economy. Month-to-month movements can be volatile, so a three-month moving average of the CAB reading is provided. This provides a more consistent and illustrative picture of national economic trends.
Applying the CAB back to 1912, it has been shown to provide a lead of two to 14 months, with an average lead of eight months at cycle peaks as determined by the National Bureau of Economic Research. The median lead was also eight months. At business cycle troughs, the CAB leads by one to seven months, with an average lead of four months. The median lead was three months. The CAB is rebased to the average lead (in months) of an average 100 in the base year (the year 2012 was used) of a reference time series. The latter is the Federal Reserve’s Industrial Production Index.
The CAB comprises indicators relating to the production of chlorine and other alkalies, pigments, plastic resins and other selected basic industrial chemicals; chemical company stock data; hours worked in chemicals; publicly sourced, chemical price information; end-use (or customer) industry sales-to-inventories; and several broader leading economic measures (building permits and new orders). Each month, ACC provides a barometer number reflecting activity data for the current month, as well as a three-month moving average. The CAB was developed by the Economics Department at ACC.
For the full data set, visit americanchemistry.com/CAB-vs-Industrial-Production.