Report: Heavy-duty truck parts prices split across regions
Key Highlights
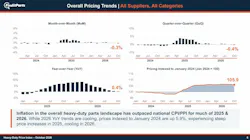
- The national HDPI reached 105.9 in October, 5.9% above its January 2024 baseline, as annual price growth slowed for an eighth consecutive month.
- Distributor prices rose year over year in the South and Midwest, while falling in the Northeast and West; the West had the highest cumulative index at 109.0.
- Overall distributor prices were down 1.4% year over year, while manufacturer prices rose 2.6% to a record index of 106.7.
- Driveline and axle costs varied by subcategory: axle shafts rose 3.4% year over year, while hardware, fasteners, and fittings had the highest cumulative index.
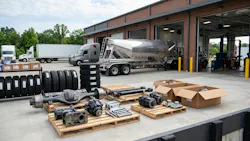
Heavy-duty truck parts inflation is cooling, but regional price swings and record manufacturer costs mean fleet maintenance budgets face different pressures depending on operating territory.
According to FinditParts’ October Heavy-Duty Price Index (HDPI), overall U.S. heavy-duty parts prices stood 5.9% above their January 2024 baseline—an index reading of 105.9—as year-over-year price growth decelerated for the eighth straight month, sliding from an 8.4% peak in February to 0.4% in October. However, the report’s inaugural regional breakdown demonstrates that national averages obscure sharp geographic disparities across the aftermarket.
“Last month, our Heavy-Duty Price Index (HDPI) showed that pricing pressure hasn’t landed evenly across parts categories. This month’s regional data shows it hasn’t landed evenly across the country either,” FinditParts CEO Matt Schweickert stated in a news release.
Regional distributor prices split
Grouping distributor stocking locations across the four U.S. Census regions shows northern and western markets seeing annual relief while the South and Midwest trend higher:
- South (16 states): Distributor prices climbed 1.7% year over year (+0.2% month over month), though the region’s cumulative index remains the lowest nationally at 103.5.
- Midwest (12 states): Prices rose 1.3% year over year despite dipping 0.3% from September, putting the region’s index at 107.1.
- Northeast (9 states): Distributor pricing saw the steepest annual drop at 2.9% year over year (-1.2% month over month) to reach an index of 104.5.
- West (11 states): Prices fell 1.6% year over year (-0.2% month over month), yet the region carries the highest cumulative inflation burden at an index of 109.0.
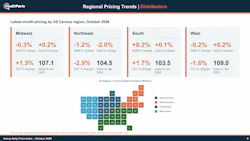
“Distributor prices in the West are up 9% since early 2024, over twice the increase in the South, and over the past year prices have risen in the South and Midwest while falling in the Northeast and West,” Schweickert said. “A national average masks this variation that matters to the fleets, repair shops, and distributors navigating the context of their own specific markets.”
Distributors cut prices while OEMs hit highs
October data also highlights a widening disconnect between wholesale channels and upstream suppliers, according to the report. Overall distributor pricing slipped 1.4% below year-ago levels (-0.7% month over month) to an index of 105.5, pushing distributors into a deflationary year-over-year environment (with September’s reading restated from +0.2% to -0.8%).
Meanwhile, manufacturer pricing climbed 2.6% year over year (+0.2% month over month) to reach a record index high of 106.7. FinditParts noted that steady manufacturer increases had not yet passed through into distributor shelf prices as of October—a trend maintenance directors should watch closely.
Why HDPI diverges from federal gauges
FinditParts compiles the HDPI using a matched-item methodology—comparing the exact same SKU at the exact same location month to month—across roughly 3 million unique in-stock SKUs representing $7 billion in inventory across 900 U.S. stocking locations. That commercial scale explains why the HDPI’s 0.4% annual reading diverges from September Bureau of Labor Statistics figures, which showed Consumer Price Index (CPI) motor vehicle parts up 0.8%—a metric roughly 85% weighted toward passenger tires—and Producer Price Index (PPI) parts manufacturing up 3.1%.
Subcategory spikes persist
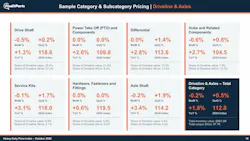
Within the Driveline and Axles category—spanning $884.3 million in tracked inventory across 97,700 SKUs at a 112.8 index (+1.8% year over year)—costs vary sharply among related chassis and powertrain components:
- Hardware, fasteners, and fittings: Holds the highest cumulative index at 119.5 (+19.5% since January 2024; +0.6% year over year).
- Drive shafts: Sits at a 118.6 index (+18.6% since January 2024), up 1.3% year over year.
- Service kits: Reached a 116.0 index, rising 3.1% year over year.
- Axle shafts: Posted the steepest annual gain in the group at 3.4% year over year (114.2 index).
- Power take-off (PTO) and components: Essential for tank fleets running pumps, blowers, and hydraulics, PTO components rose 2.6% year over year to a 109.8 index.
- Hubs and related components: Recorded the smallest cumulative increase since January 2024 at 4.5% (104.5 index), though up 2.7% year over year.
“Pricing variation doesn’t stop at the category level,” Schweickert added. “Within the Driveline and Axles category, axle shafts are up over 3% from a year ago, while drive shafts are up just over 1%. FinditParts’ HDPI gives the industry visibility down to the subcategory, where buying and pricing decisions actually get made.”
About the Author
 Jason McDaniel
Jason McDaniel, based in the Houston TX area, has more than 20 years of experience as an award-winning journalist. He spent 15 writing and editing for daily newspapers, including the Houston Chronicle, and began covering the commercial vehicle industry in 2018. He was named editor of Bulk Transporter and Refrigerated Transporter magazines in July 2020.
Related

 img_4554